· Cloud Development · 10 min read
SAP CAP Developer Dashboard
Explore the CAP Developer Dashboard, a powerful tool that enhances cloud application development through real-time insights, streamlined operations, and improved observability for both new and experienced developers.
Introduction
When developing CAP applications, we often use various tools to understand how the system behaves. The CAP Developer Dashboard meets this need by providing a single interface that brings together important information about services, events, and performance metrics. This setup makes it easier to monitor, trace, and debug applications, allowing developers to gain real-time insights without having to switch between different tools.
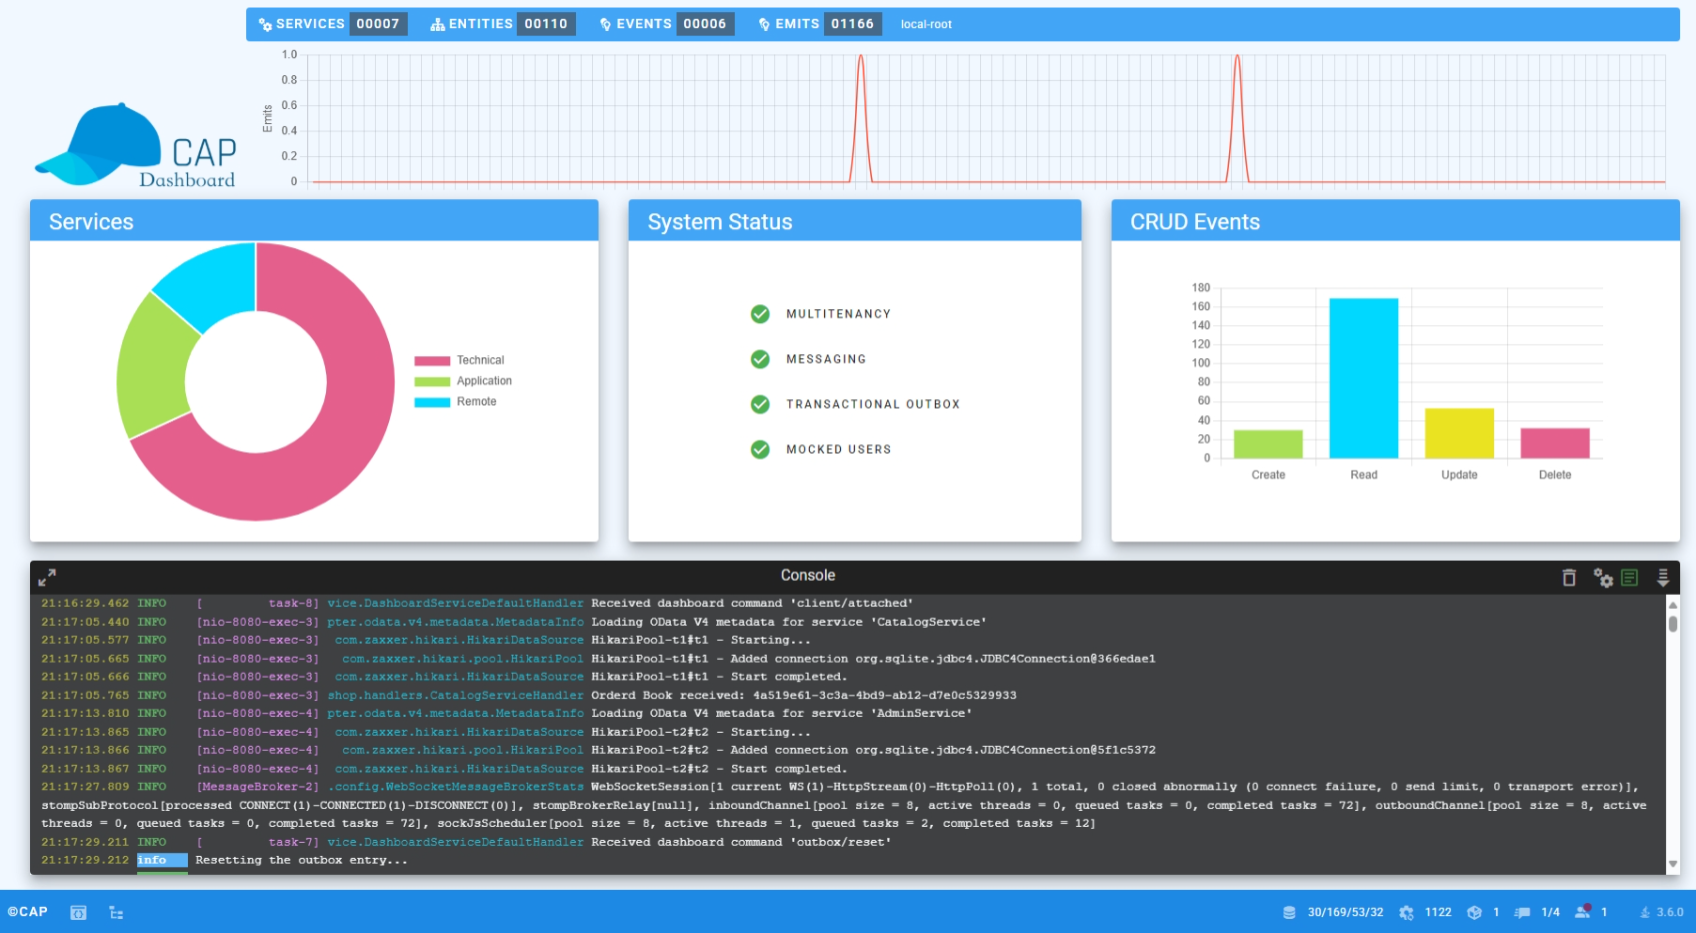
Above, we can see that the landing page of the CAP Developer Dashboard offers an overview of key features, including service status, event logs, and performance metrics, all in one place. Console log settings can be adjusted on the fly, enabling users to filter information according to their needs.
While currently available only for Java applications, the dashboard is a valuable resource for anyone looking to deepen their understanding of how CAP works. The importance of this tool was highlighted during the keynote at RECAP 2024, where the call to action was to consider whether it makes sense to invest time in building out such tooling—and my answer is a resounding yes. By exploring its features, I have gained better insights into CAP’s architecture and improved my overall development practices.
This article will share some of the functionalities of the CAP Developer Dashboard that I found useful and illustrate how it can support your development efforts. The dashboard not only simplifies the management of CAP applications but also enhances observability, making it easier to troubleshoot and optimize performance. With insights from my experience, I hope to provide you with practical knowledge that can be applied in your own projects.
”Everything is a Service, Everything is an Event”
This fundamental CAP philosophy is elegantly demonstrated through the dashboard’s architecture, but with an interesting twist. While most CAP applications are built around OData services and CDS data models, the dashboard takes a different approach that still embraces CAP’s core principles. The application operates purely through services that communicate via WebSocket events, showcasing how CAP’s “service-first” mindset extends beyond traditional database-driven scenarios.
Service and Event Interaction
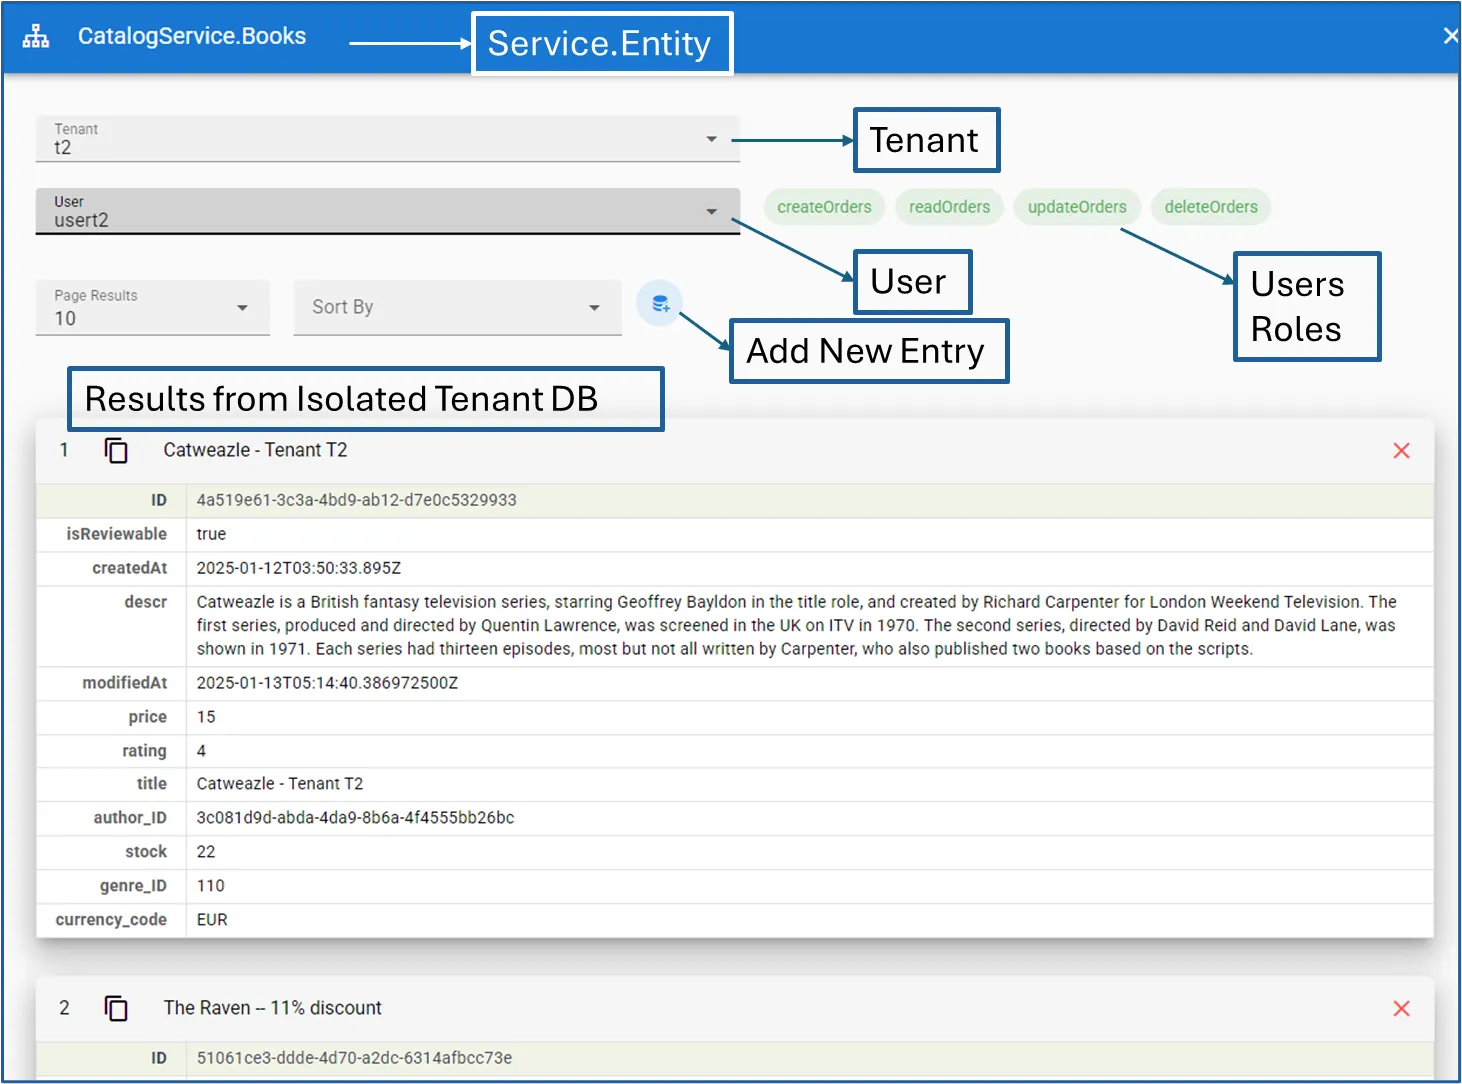
The Exposed Entities screen perfectly illustrates this event-driven architecture in action. When you interact with the playground, every action triggers a service event - from requesting entity metadata to executing queries. These events flow through WebSocket channels, with the front-end Vue.js components emitting request events and listening for response events. This creates a real-time, interactive experience where developers can experiment with entity queries, manipulate parameters like user context, tenant isolation, pagination, and sorting - all orchestrated through a choreography of events rather than direct API calls.
This approach demonstrates how CAP’s service-event paradigm can be applied beyond traditional CRUD operations, making it equally powerful for building interactive, real-time applications.
Observing Events in Action
If we goto the Chrome Developer Tools to watch these service events flow through WebSocket connections in real-time, we will see how a simple request to read Book entries transforms into a series of events: 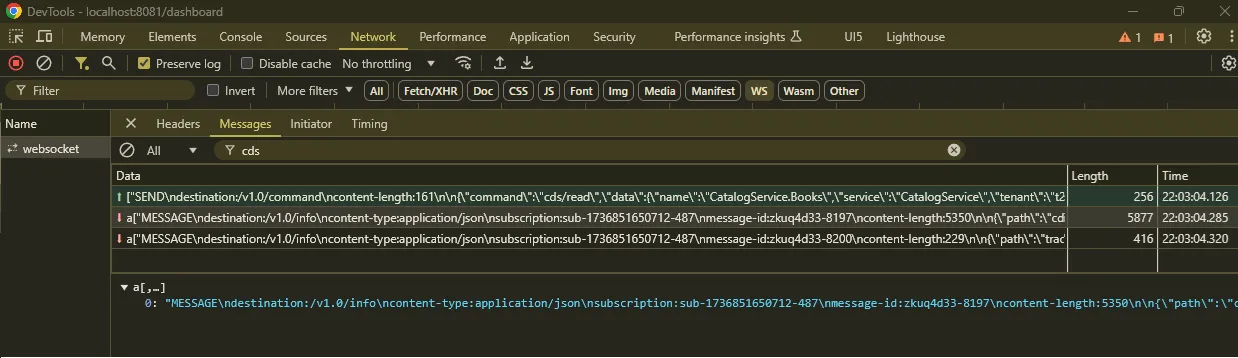
- First, we see the initial SEND command through WebSocket. This event carries a request to read Book entries from the CatalogService, specifically for tenant ‘t2’ and user ‘usert2’.
- Shortly after, we observe the response event arriving through the same WebSocket channel. It carries our payload of CDS Book entities - the data we requested has made its round trip successfully through the dashboards event-driven architecture.
- The system also emits a trace event, providing visibility into the interaction. This is CAP’s built-in tracing at work, giving developers insights into how events flow through the system.
- Finally, we see this trace materialize in the dashboard’s main console log, providing a human-readable record of the entire interaction. This demonstrates how the dashboard not only facilitates service-event interactions but also enhances debuggability by making these interactions observable and providing detailed logs for troubleshooting.

This sequence perfectly illustrates how “everything is an event” works in practice - from the initial request, through the response, to the observability traces, each step in the interaction is captured and transmitted as an event.
Dashboard Features in Practice
Having explored how the CAP Developer Dashboard embodies the core philosophy of event-driven services, let’s examine how this manifests in practical features that enhance the development experience. Each feature demonstrates this architecture in action, starting from fundamental environment management through to advanced multi-tenant operations.
1. System Environment
CAP applications rely on environment configurations that adapt based on where they run. The System Environment page unifies configuration across four logical areas:
- CDS Properties for runtime profile settings
- Service Catalog showing available services
- Service Bindings displaying connection details
- Application env for system variables
The CDS Properties view shows settings specific to your runtime profile - whether running locally, in hybrid mode, or production. Each profile tailors these properties to match its deployment context. 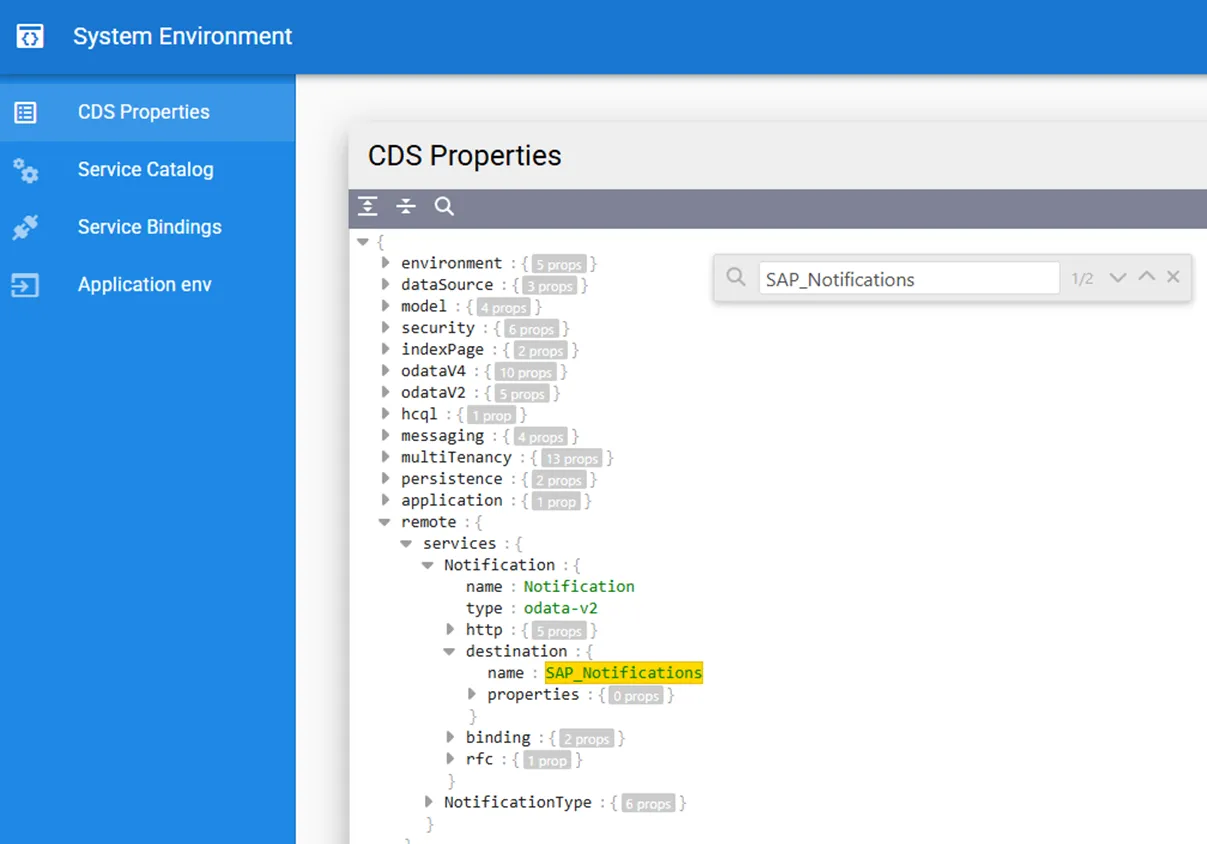 Here we see how easily you can filter through profile-specific settings. The “SAP_Notifications” destination shows up in 2 different configurations based on the active runtime profile.
The Service Catalog visualizes your application’s service landscape. 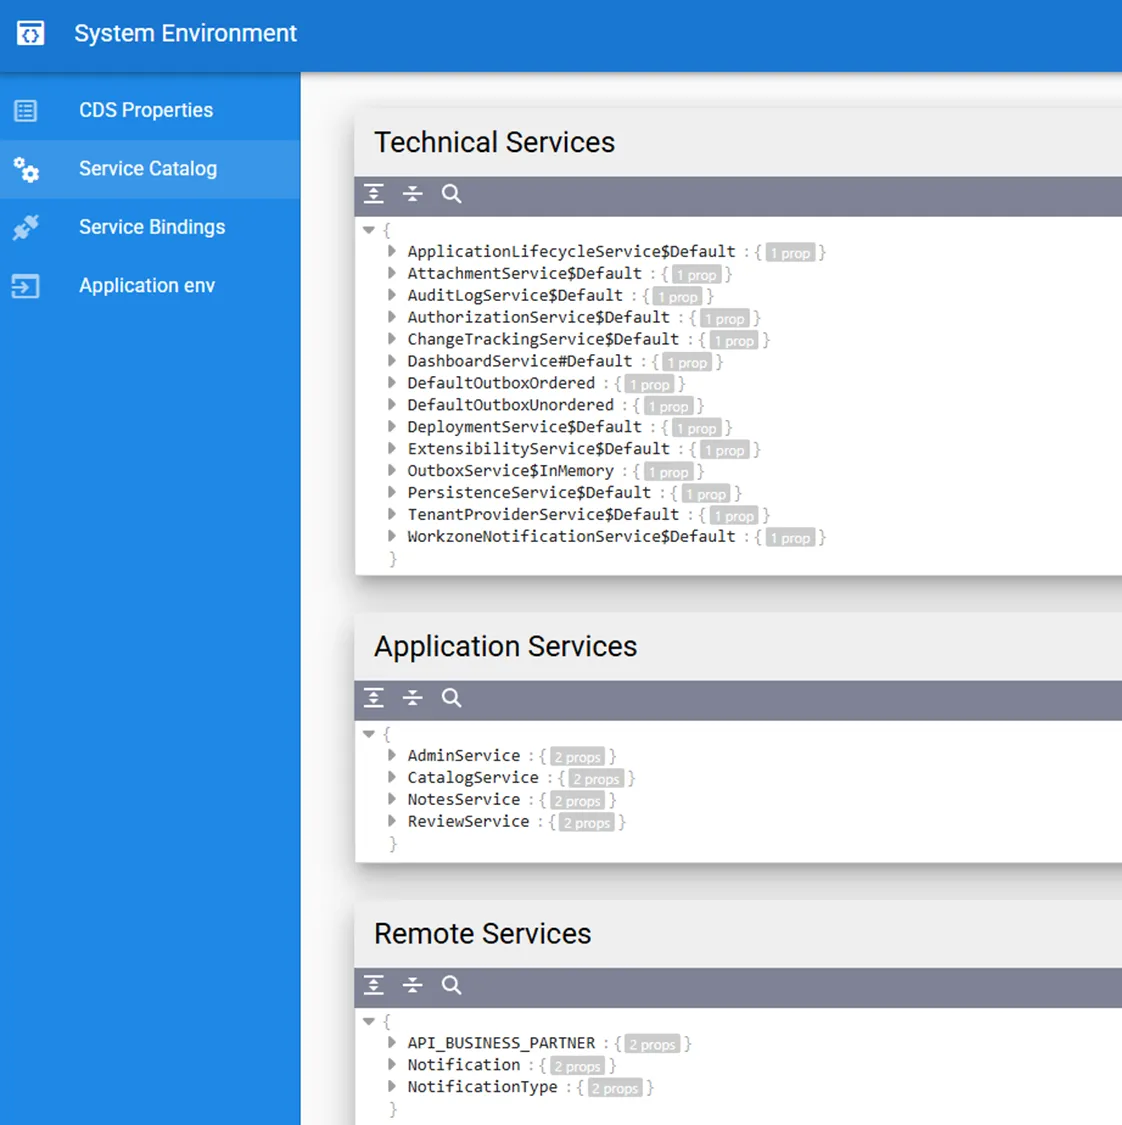 From technical services through to remote S/4 HANA and BTP Workzone connections, each service entry shows its current status, type, and connection details.
The System Environment page transforms what would typically require multiple terminal commands, text searches, and environment variable lookups into a unified, visual interface - bringing clarity to your application’s runtime world.
2. Exposed Entities
We saw the event-driven nature of the Exposed Entities screen earlier, showing how the screen serves as an interactive playground for developers. It offers:
- A complete catalog of exposed services and their entities
- Built-in authentication and tenant context
- Visual query construction
- Simplified CRUD operations
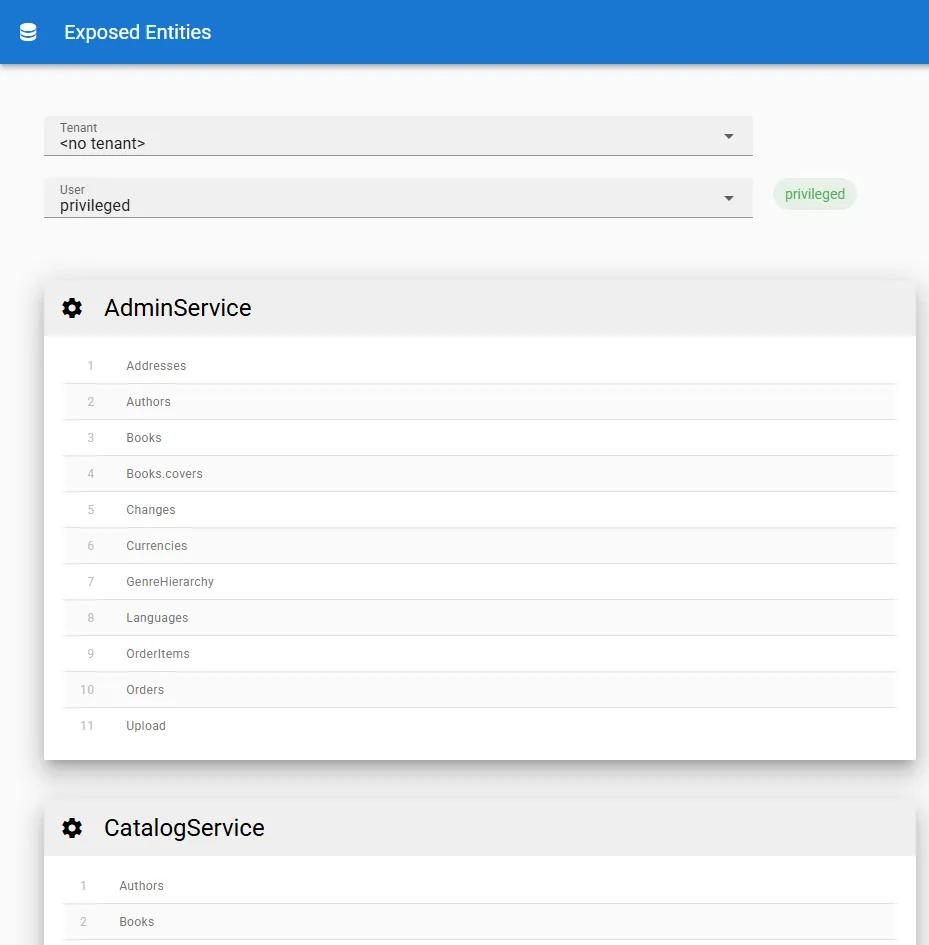 The benefit of Exposed Entities page is its immediate access to service operations without the overhead of writing code, configuring external tools, managing authentication tokens, or switching contexts between different applications.
3. Event Trace
The Events page provides visibility into service interactions through trace events. Users appear in a list on the left, while the main panel displays their trace events, showing how requests flow through the application’s services. 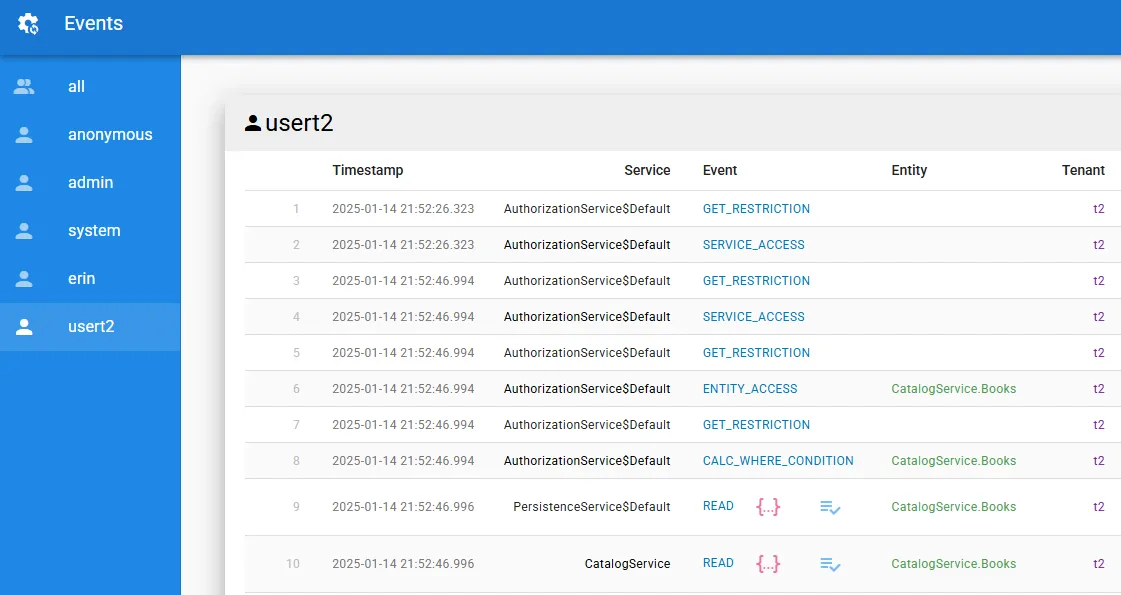 Following our earlier Books query, we can trace its complete journey through:
- Authorization Service - verifies the user can access the Catalog Service, the entity and perform the query
- Persistence Service - reading the data from the tenant database
- Catalog Service - formatting the response
The Events page brings immediate visibility to service interactions during development and testing. Similar insights can be gathered using Cloud Logging services, Kibana dashboards, or enabling verbose trace logging in your application configuration.
4. Transactional Outbox Events
The transactional outbox pattern ensures events are only triggered after successful transaction completion, adding resilience to event processing. Think of it like ABAP’s Update Process - events should only occur after the main transaction commit succeeds.
 https://cap.cloud.sap/docs/guides/data-privacy/audit-logging#transactional-outbox
CAP implements this pattern across multiple services and plugins including Audit Logging, Change Tracking, Attachments, Messaging, Event-Queue and Notifications and more. 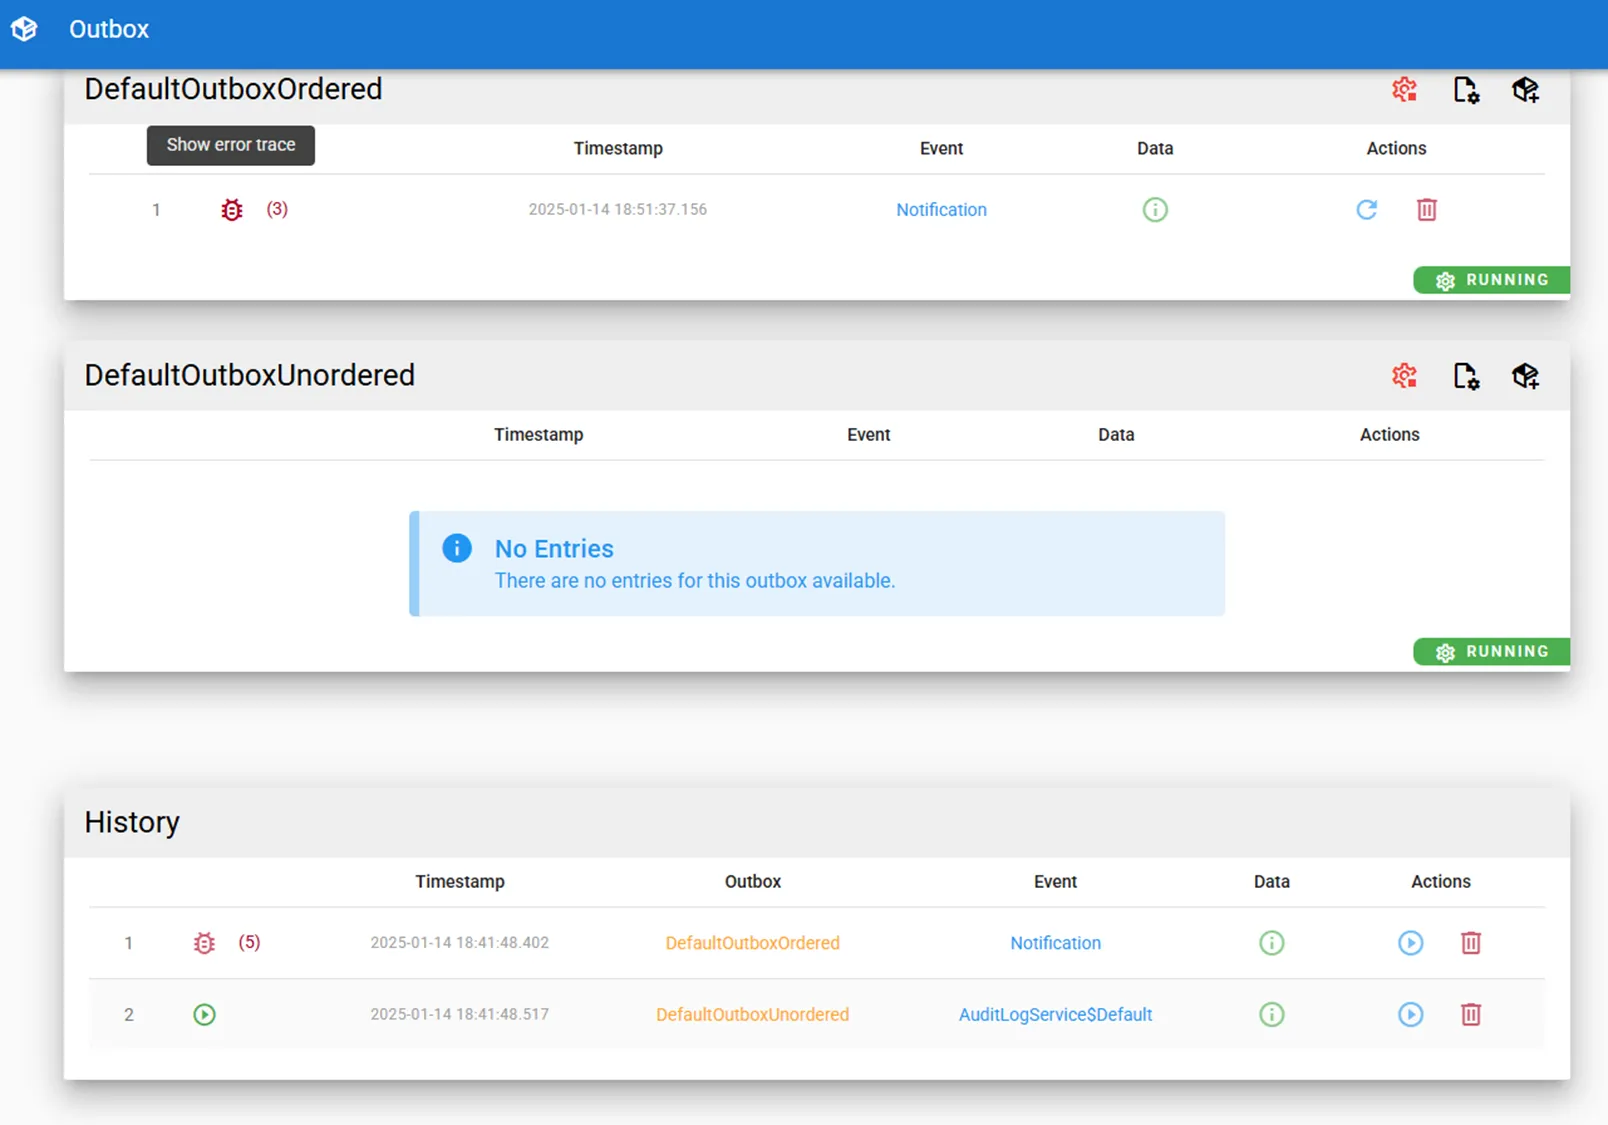 The outbox panel above shows three operational views, more if we created custom Outboxes for individual services:
- DefaultOutboxOrdered handles sequenced events (Workzone Notifications)
- DefaultOutboxUnordered processes independent events (Audit Logging)
- Outbox History tracks delivery status and retries
 Here we see a Workzone Notification that has failed three times but continues retrying, demonstrating the pattern’s resilience. The history shows a previous notification succeeded after five attempts, while audit logging continues independently.
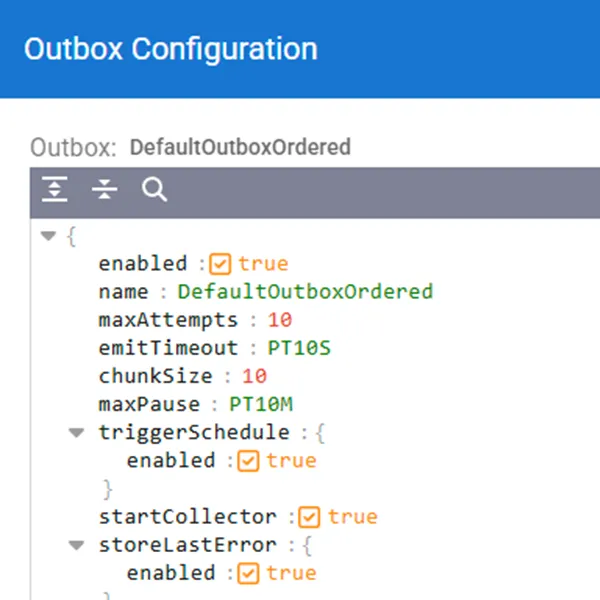 The configuration reveals CAP’s built-in resilience:
- 10 retry attempts
- Exponential backoff
- Maximum 10-minute delay
This visual interface transforms typically hidden outbox operations into an observable, manageable process - letting developers monitor, troubleshoot, and even replay failed events.
5. Messaging and Service Subscriptions
While CAP events handle in-process communications, messaging facilitates cross-service interaction through message brokers. The dashboard provides a broker-agnostic playground for testing these integrations.
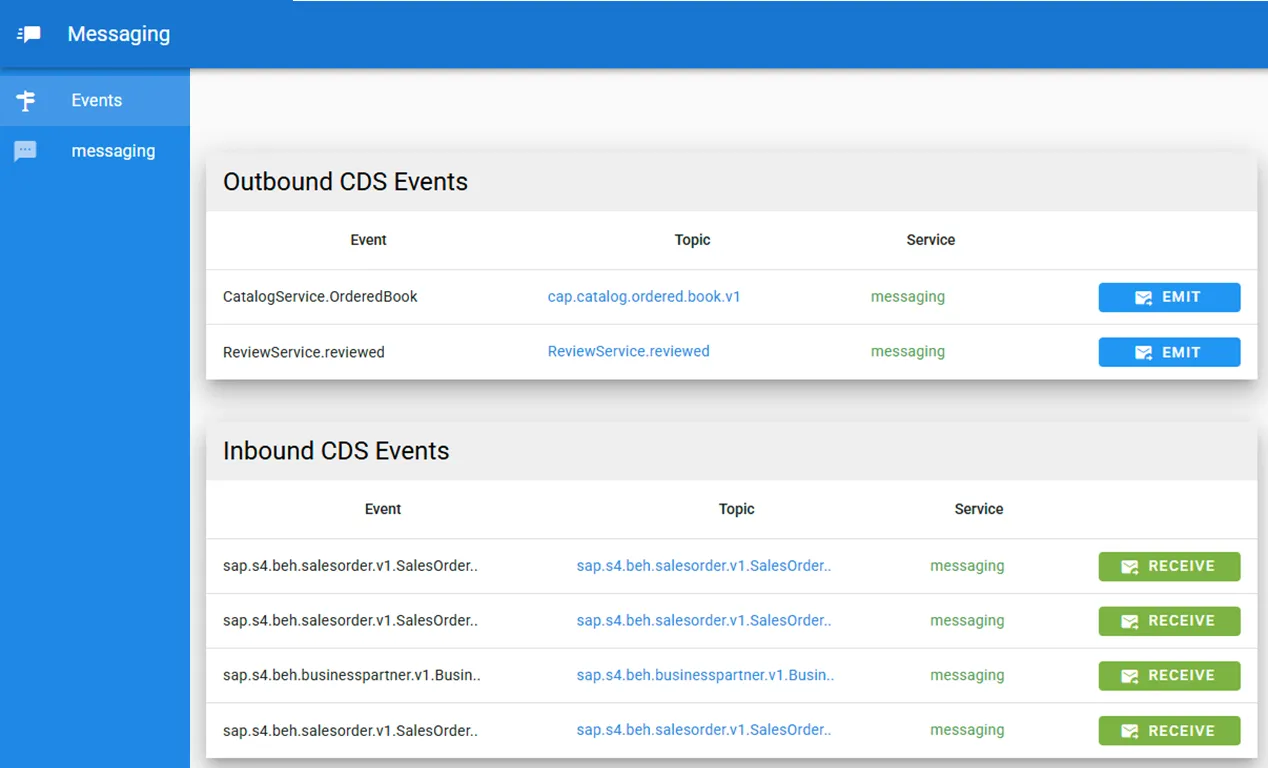 The Events panel divides messaging into two sections:
- Outbound CDS Events we emit to other services
- Inbound CDS Events we receive from external sources
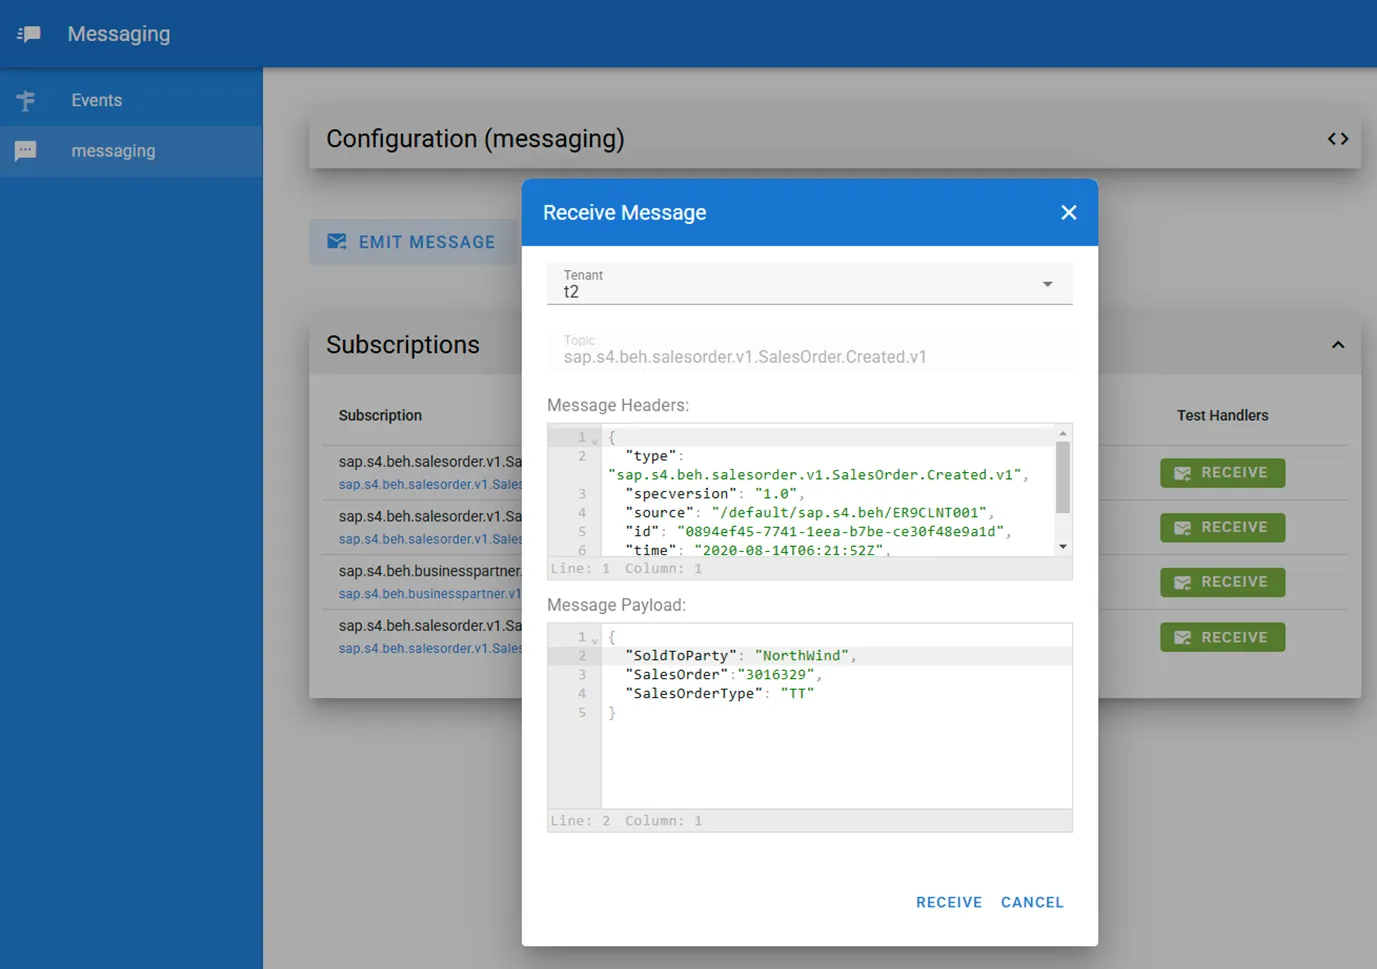 The configure messaging service provides a broker-agnostic testing environment. Here we simulate an S/4HANA Order Created cloudevent by specifying:
- Tenant context (t2)
- Topic
- Message headers
- Message payload
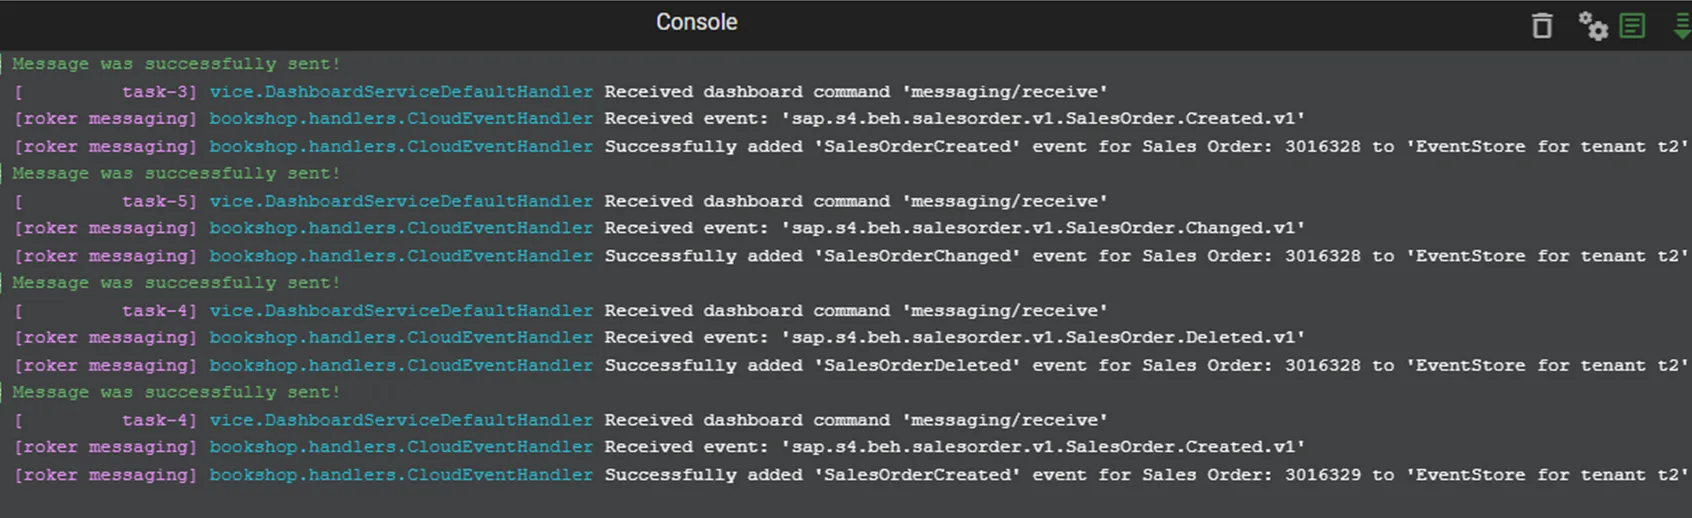 The simulation results show our subscription handler capturing the cloudevents, with the console log revealing how SalesOrder events (Create, Change, Delete) are persisted to a tenant-aware eventstore.
This playground transforms what would typically require a mock service implementation or actual broker configuration into an interactive testing environment. This becomes particularly valuable when working with event-driven architectures where development teams may not maintain or have direct access to enterprise messaging services like Event Mesh - removing infrastructure dependencies from the development cycle.
6. Multi-tenant Operations
The User Management interface, despite its name, provides powerful tenant management capabilities through two key areas - Tenants and Users.
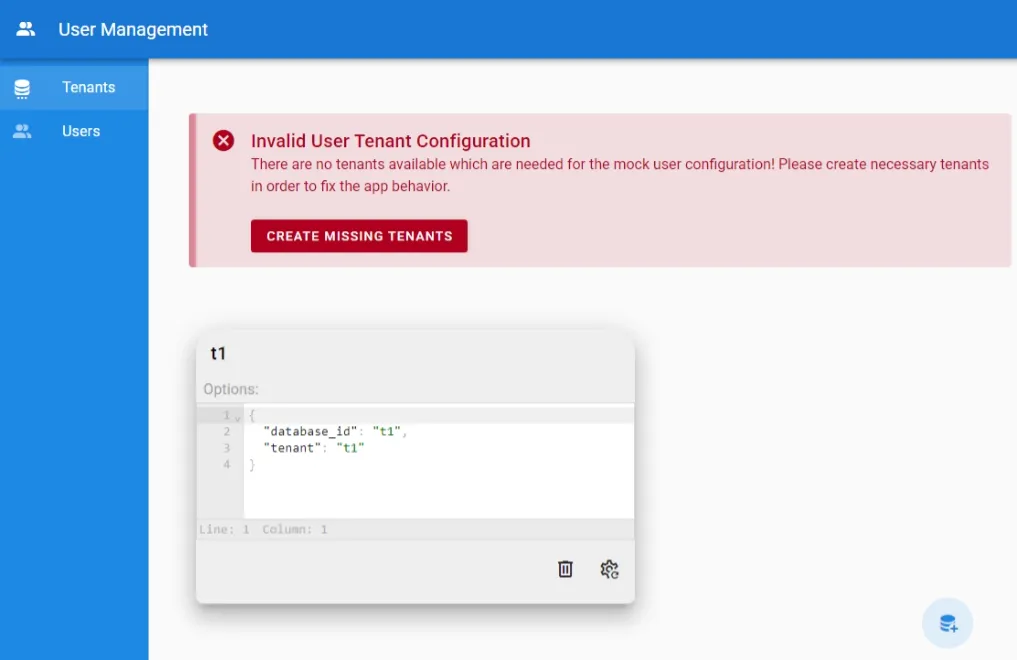 The tenant panel displays each tenant’s configuration, showing:
- Database identifier - think Hana Cloud HDI container ID
- Tenant context - think subscribed Cloud Foundry subdomain
- Management options (subscribe/delete/upgrade tenants)
The Users view not shown here complements this by showing in our case (local-mtxs profile), mock users configured for development, including their:
- Assigned roles
- User attributes
- Tenant associations
These mock users drive our tenant provisioning, with the error strip indicating missing tenants from our configuration. 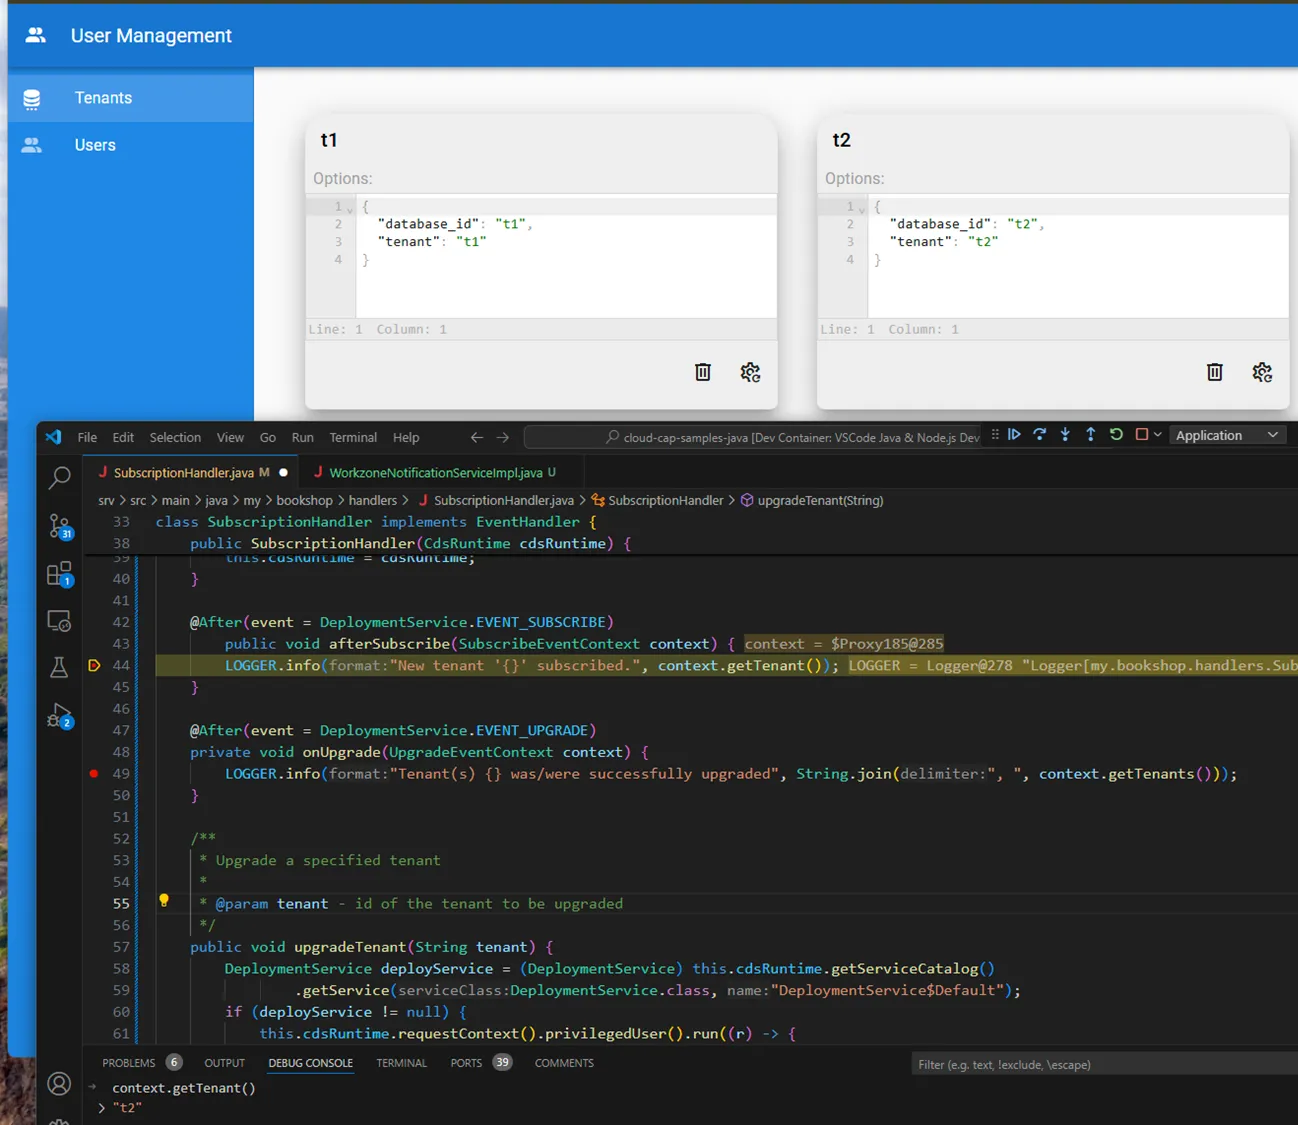 After triggering the missing tenant creation, we hit a Java breakpoint in our SubscribeEvent handler, demonstrating CDS events flowing freely between the NodeJS MTX Sidecar CDS Deployment Service and our Java event handler.
 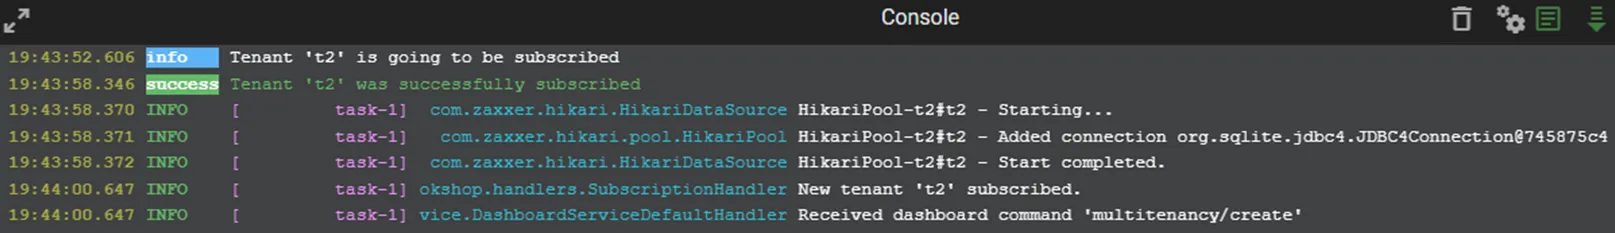 The console reveals the complete provisioning flow:
- Tenant t2 subscription event
- Custom handler execution
- HikariPool database creation in SQLite
This interface transforms complex multi-tenant operations into manageable development tasks, providing a complete environment for testing tenant-aware features and user contexts.
Conclusion
The CAP Developer Dashboard transforms common development tasks into visual, interactive experiences. From environment configuration to multi-tenant operations, it provides immediate insights into CAP’s core concepts and patterns. For new developers, it illuminates event-driven architecture, service interactions, and multi-tenant operations. For experienced developers, it streamlines daily tasks and provides new ways to observe, trace and debug complex scenarios.
During development, the dashboard consolidates views typically spread across deployment logs, service logs, database traces, and cloud monitoring solutions. This shift-left approach surfaces runtime behaviors immediately in the development environment rather than discovering them in production systems. The integration replaces multiple standalone tools with a single interface providing consistent context across all CAP services. Most importantly, the dashboard exposes CAP’s architectural patterns visually - event chains, tenant behaviors, and service interactions become observable and understandable during development.
The dashboard joins a growing trend of developer portals that prioritize developer experience. Like Backstage, Cortex, Atlassian Compass, and other modern developer platforms, it recognizes that productive development requires more than documentation - it needs integrated tools providing immediate insight into system behavior.
While currently available for Java applications, it shows the potential impact of integrated development tools in the CAP ecosystem. Try the dashboard in your next CAP Java project - the insights it provides might just transform your development process, it did for me!
About the Author
John Patterson is a Principal Software Engineer at Second Phase Solutions, specializing in cloud application development, event-driven architecture, and DevOps practices. With over 5 years of experience in building complex CAP applications, John is passionate about leveraging technology to enhance developer experiences and productivity.
If you’re interested in exploring how DevOps tools and practices can streamline your development processes or have questions about the CAP Developer Dashboard, connect with John on LinkedIn. Join the conversation about innovative solutions in cloud development and DevOps!